
Erring on the Side of Stubborn Inflation
Erring on the Side of Stubborn Inflation

Follow me @TheBon_Scott on Twitter, and please share this newsletter if you find my work valuable.
As I’ve previously discussed, inflation has remained stubbornly high so far this year relative to the Fed’s 2% target. The market has been shrugging it off so far, although under the surface, industries and sectors that generally perform better in an improved GDP growth environment — and higher inflationary environments — have been outperforming: Metals, materials, industrials and energy. Recent economic data suggests that the rotation to those sectors is likely to continue.
Last Friday, the core Personal Consumption Expenditures (PCE) price index, which excludes volatile food and energy costs, came in at expectations and increased 2.8% on a 12-month basis, down from 2.9% the prior month. The 2.8% 12-month core PCE rate in February was the lowest in 3 years.
But over the last 3-months, the core PCE is up at a 3.5% rate. It appears to be remaining sticky/stubborn, and it has raised much debate about how soon the Fed might cut rates and by how much. Presently, Fed Fund futures are still pricing in a little better than a 50% change of a .25% rate cut at the Fed’s June meeting — 56%, to be precise.
The market is still expecting Fed rate cuts this year, even though improvement on the inflation rate seems to be stalling and 2024 GDP growth projections have been improving — which are now running around a solid 2.5% expected GDP growth rate on average. Historically, commodities have performed well in an environment where the economy continues to plug along and the Fed is lowering interest rates.

Couple that with the fact that commodities are trading at the low-end of their historical value relative to the S&P 500 index, and you get an opportunity for a mean-reversion trade as commodities play some catch-up.

Furthermore, today we got higher-than-expected manufacturing data as the March Purchasing Managers Index (PMI) came in at 50.3, versus the 48.3 that was expected, and higher than the previous month’s number of 47.8. The March reading was the highest since September 2022, and the first time manufacturing activity has expanded since October 2022. PMI readings above 50 indicate an expansion in manufacturing activity, while readings below 50 indicate contraction.

Additionally, China also reported higher-than-expected manufacturing data, this morning, as China’s PMI was 51.1 in March versus the 50.8 that was expected. March’s PMI reading was the strongest in 13 months.
Thus, stronger PMI readings in the U.S. and China help to further boost the outlook for commodities — even while uncertainty remains over the specificity of Fed rate cuts this year.
The S&P 500 has now rallied 5-months in a row, and while it could continue to rally uninterrupted for a period, I think it’s more probable that we’ll see the S&P essentially trade side-ways (consolidate) for a while as rotation continues to generate outperformance for the metals, materials and industrials.
Long-term Treasury yields jumped on this morning’s strong manufacturing data, putting some downward pressure on stocks. And while the decline in the major indexes was small — down .20% on the S&P 50, the metals sector was up nicely again with of .91% on the S&P Metals & Mining ETF (XME). I’ve been discussing my bullishness on gold and gold mining stocks, as well on silver and silver mining stocks. Copper and copper mining stocks have also performed very well, as have aluminum stocks.

If the 10-year yield continues to rally from here, and break above resistance at its February March highs (4.354%), the larger the profit-taking pullback we’ll see in the major indexes. But the metals, materials and industrials, and the like, will still likely outperform. They’re the place I continue to want to be.
Back to gold. Gold made another new all-time high, today, and while some profit-taking is probably in order, the trend remains firmly up.

Stocks of gold mining companies continue to perform strongly, as well. The Gold Miners ETF (GDX), is now testing resistance at a junction of horizontal price resistance at the $32.35-$32.40 area, and a 2-year long downtrend line meeting at the same area. Note: horizontal support and resistance levels always have more weight than slopping uptrend or downtrend support & resistance lines. In this case, they’re meeting at the same area, giving a potential breakout therefrom all the more credence/reliability.

Although some short-term profit-taking is certainly possible, I do think the GDX goes on to breakout and continued to move higher.
Let’s take a closer look at the materials sector. Materials (XLB ETF), have been outperforming the S&P 500 since early February (see the bottom section of the chart below). Will it continue, and if so for long and for how much?

On a long-term chart, the recent outperformance of the materials sector is just a blip, but on prior occasions where the XLB has broken out of a large base - as it did in mid-March — it has rallied until it was notably overbought on its RSI. We're currently quite far from that being that case.

Also, can the XLB's relative strength versus the S&P 500 improve to at least the middle of the range where it has gotten to on prior occasions (see the lower part of the chart above)? Chances are that it will at least make a good-go of it.
That’s it for now, and as always, I’ll be posting frequent market commentary on WMI’s private Twitter (X) page.
Now, on to a new/updated long & short focus watchlist.
Focus Watchlist
I try to recommend trades that are timely and that a breakout/breakdown is likely to occur soon. If I take a stock or ETF off the focus watchlist, it may be because the trade needs more time to ripen, it ran away from us, or I’m no longer considering it at all.
Longs:
Added 4/3:
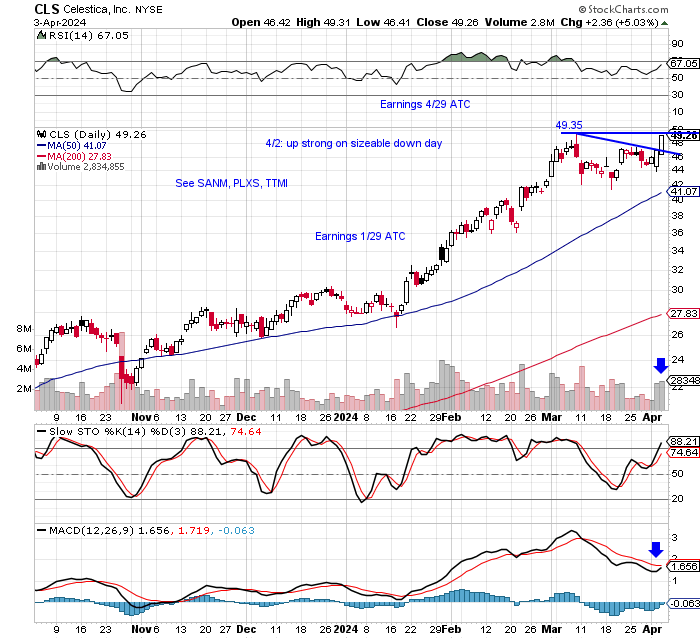
Celestica (CLS). I watched CLS rally all day today hoping it would pullback a bit, but it didn't. It's in the process of making a continuation breakout, with its MACD about to trigger a fresh buy signal. I make take a partial position on any small pullback, and look to buy the remainder on a move to a new high — depending on market conditions.
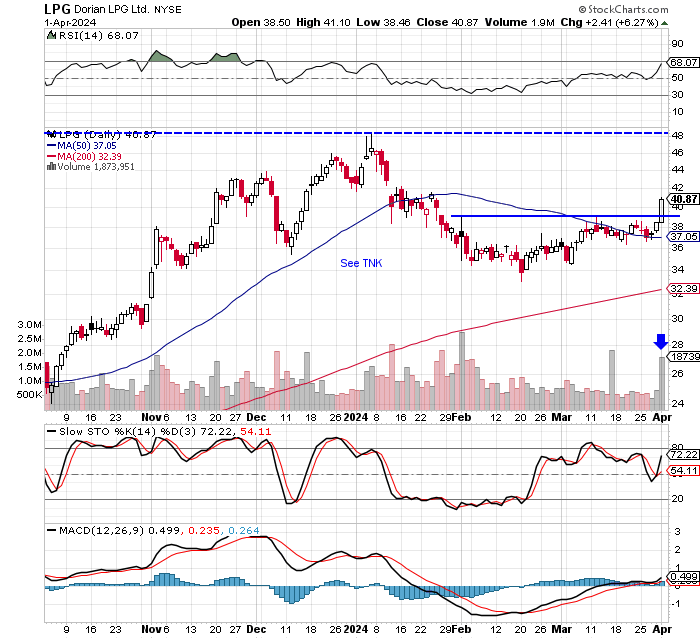
Dorian LPG (LPG). LPG was up strong and broke out on Monday, on heavy volume. Chances are pretty good that it will make a run to its January high. I’ll be looking for a pullback to buy into.
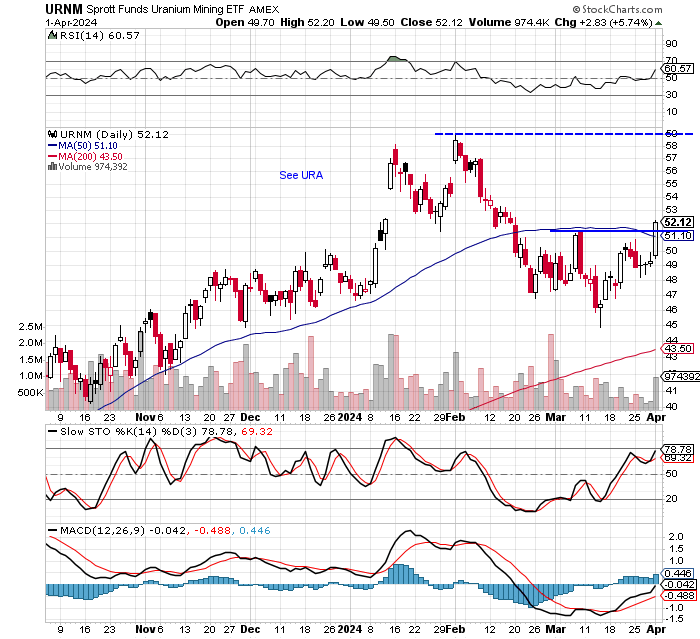
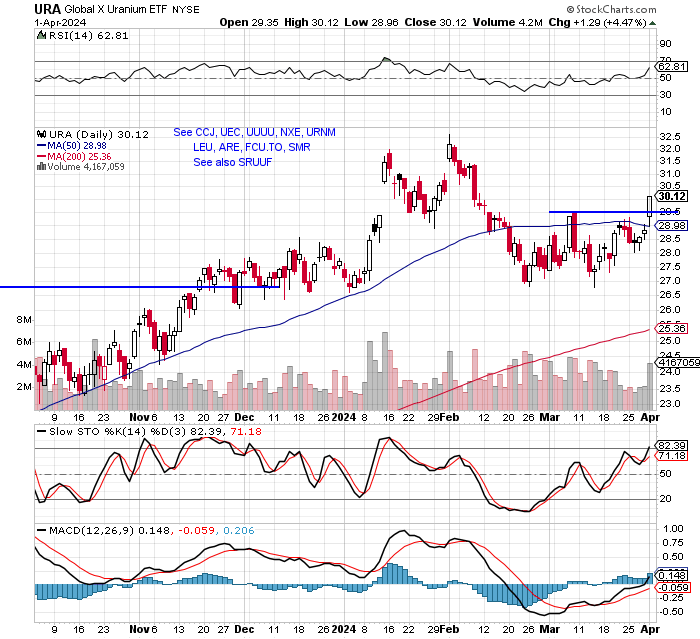
The Sprott Uranium Mining ETF (URNM). After breaking out today, the URNM looks to have a nice entry on a small pullback from here (if we get one), with the PT being the $58-$59 area. I’m also considering the URA Uranium ETF (below).
The URA:
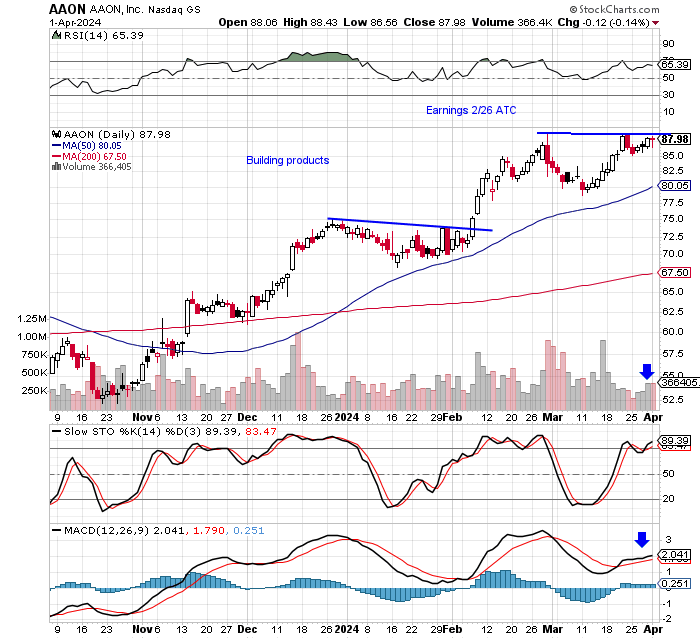
AAON (AAON). AAON, which is in the home building products sector, is nearing a breakout of a cup & handle formation with a supporting MACD. AAON would probably be a take profits after a 10% +or- move type trade. This trade loses its appeal, though, if the 10-year yield continue to move higher (higher mortgage rates).
The Semiconductor ETF (SMH), via the 3X leveraged bull SOXL, remains on the focus watchlist. This may take some time. Ideally, it pulls back to back-test the uptrend line — which roughly coincides with its 50 dma. I’m being patient with this one, waiting for a variety of signals to come together. i.e. How the leading stocks in the ETF are acting/shaping up, the market environment, long-term Treasury yields, etc.

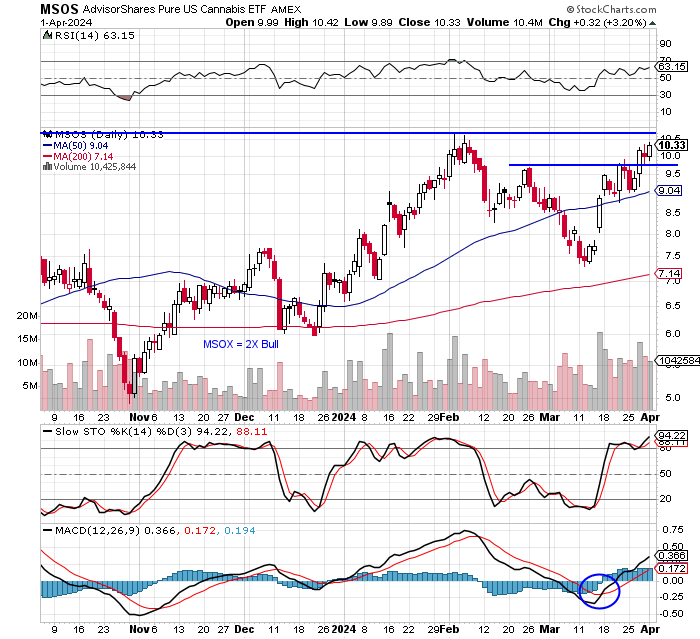
The Pure U.S. Cannabis ETF (MSOS). MSOS remains on the focus watchlist. I’m still waiting for a setup that I feel good about as this can be quite a herky-jerky trader.
HUYA (HUYA). I’ve had HUYA, a Chinese stock, on the focus watchlist before. It looks like it may try to break out of its triangle soon. This would be an aggressive trade.
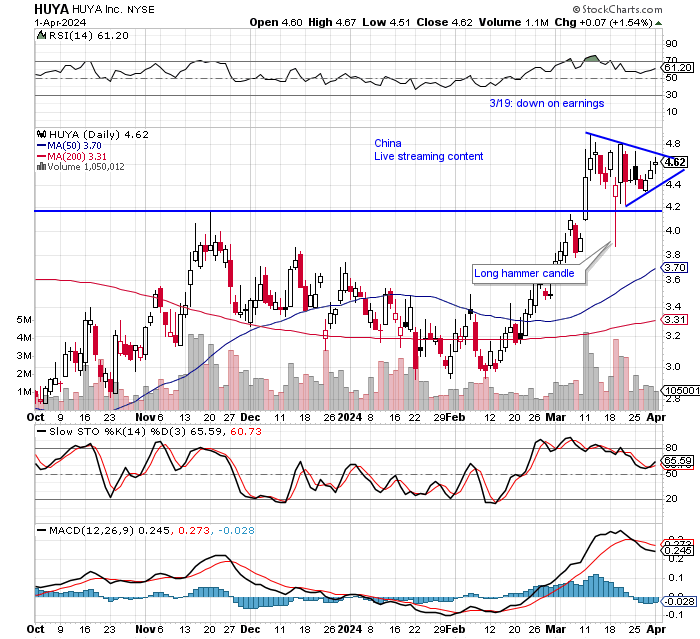
I has added EH, another Chinese stock, to the focus watchlist I sent out last Wednesday evening. It rallied 9% the next day. There’s no way of knowing if HUYA will do the same, of course, I’m just pointing out that these Chinese stocks can make very sharp/quick moves when they break out.
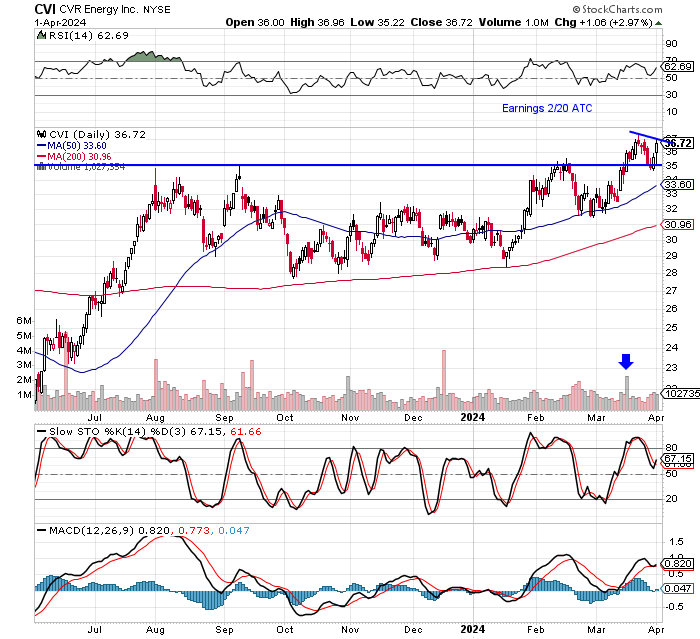
CVR Energy (CVI). CVI is an oil stock. I got faked out on another oil stock a few weeks back (CHX), but crude continues to grind higher and this is a nice setup. I may start building a position in CVI on a pullback from here. I’ll keep you posted.
Shorts:
Added 4/2:
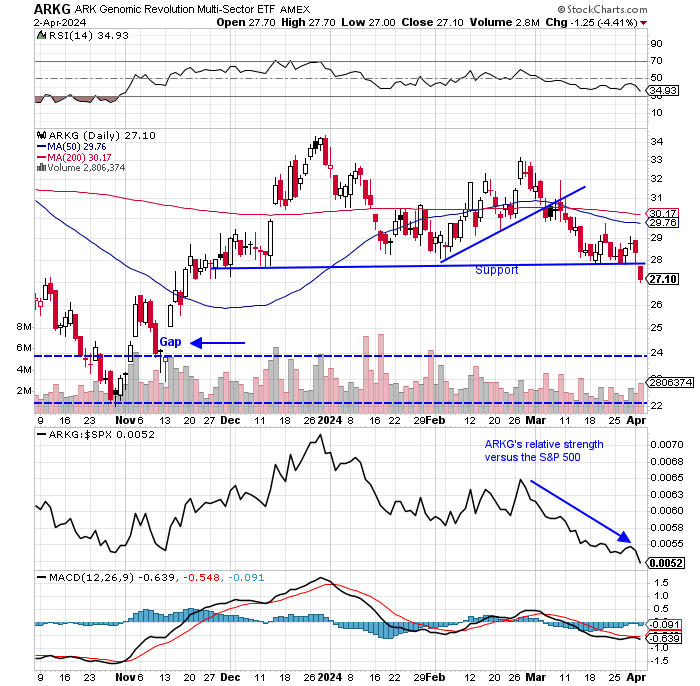
ARK Genomic Revolution ETF (ARKG). ARKG was down hard/broke down on Tuesday, on the jump in yields, as biotech’s are typically sensitive to higher yields and rates (most small and mid-cap biotechs need to use a lot of debt financing). Ideally, we get a bounce on ARKG to short into, but I wouldn’t count on much of one. Initial downside PT is to fill the November gap at $23.90, but it’s vulnerable down to its October low if yields keep rising.
Added 4/2:
Synaptics (SYNA). SYNA broke down through key price support and its 200 dma, yesterday. It’s ready to be shorted now, but even better if we get a little bounce to short into (I wouldn't count on much of one). Downside PT is the low 80s.

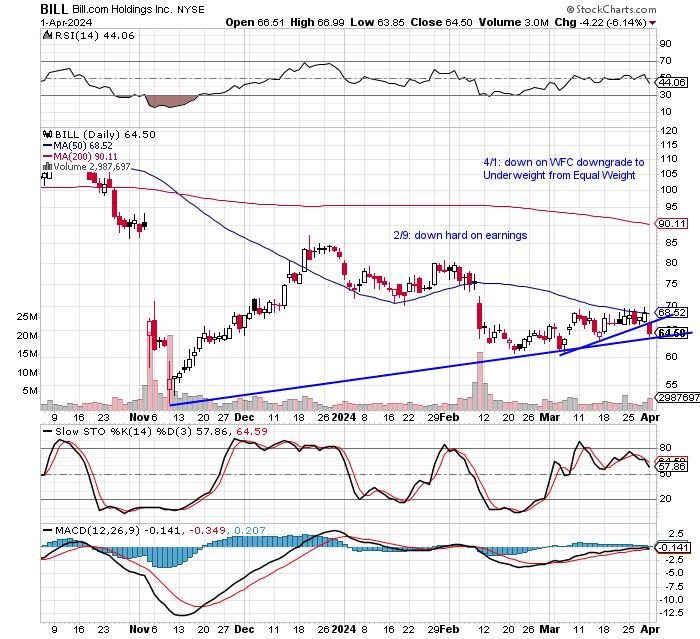
Bill.com (BILL). BILL is in the process of breaking down now. It was down hard today on a pick-up in volume. I may start with a partial short position on a bounce from here (if we get one), and go from there.
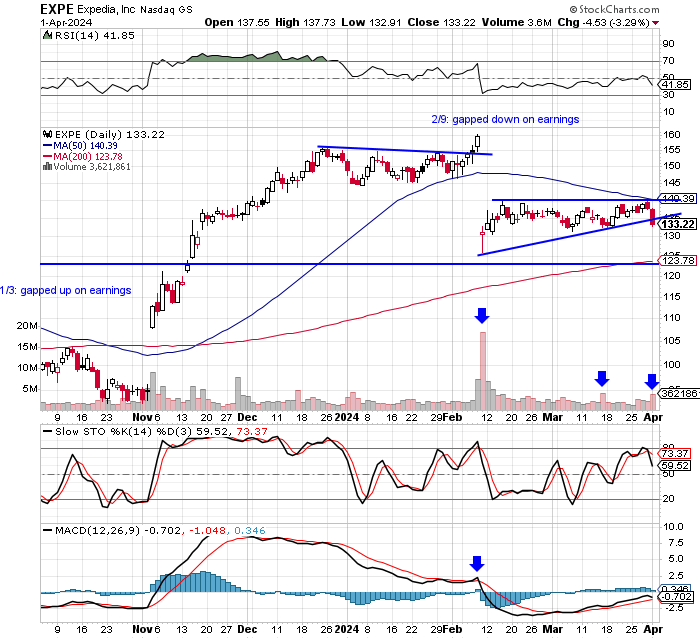
Expedia (EXPE). EXPE broke down from a bear flag, today, on a pick-up in volume. I may look to short EXPE soon if it continues to show poor relative strength.
That’s it for now, let me know if you have any questions.
As always, there are many more stocks on my watchlists and things can always happen or develop quickly. I’ll let you know on the Twitter page if/when such a trade comes up.