
Don't Try To Be a Hero

Follow me @TheBon_Scott on Twitter, and please share this newsletter if you find my work valuable.
Readers of this newsletter and my Twitter posts are aware that I’ve been quite bearish on the market since the beginning of August, in large part due to the risk of rising long-term Treasury yields combined with expensive stock valuations — a bad combo — as well as the diminishing grip that the AI frenzy had on the market.
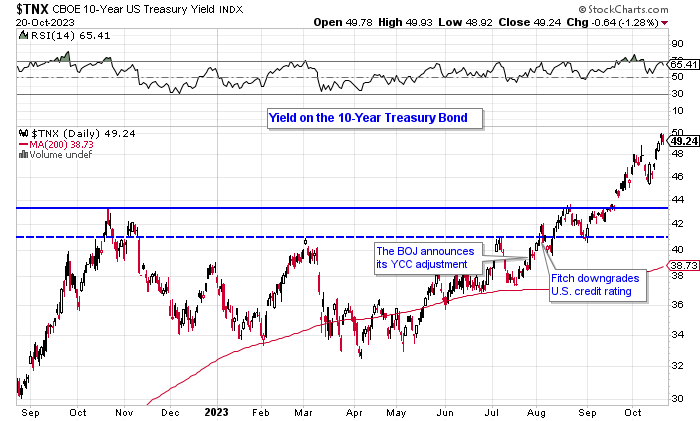
At that time, I elaborated why I felt long-term Treasury yields were going much higher. i.e. The supply and demand effect of the need to finance the exploding U.S. government deficit, the recent Fitch downgrade of the U.S. credit rating which discussed the same, and also the long-term effect of Japan starting to loosen its yield curve control (YCC), and potentially start raising its interest rates.
With the 10-year Treasury yield then at 4.06%, in my August 6th newsletter, U.S. Debt Downgrade, Rising Long-Term Yields and Apple's Earnings Report Slams the Brakes On the Stock Market Rally, I wrote,
A 10-year yield breakout over the August 2022 high of 4.33% would likely induce a substantial decline in stock prices, and eventually a probable test of key support at the S&P 500 4200 level. The recent breakdown in the Long-Term Treasury Bond ETF sends an ominous warning that long-term Treasury yields are most likely to go materially higher.
In my September 7th newsletter, with 10-year yield then at 4.29%, I wrote, “A definitive breakout in the 10-year yield over the [4.33%] August 2022 high very likely results in a breakdown through the 4335 support level, and a test of price support at 4200 and the nearby 200 dma.”
Long-term yields have continued to rally as economic data continues to not only reflect a resilient economy despite sharply higher interest rates, but a surprisingly strong economy. A much higher-than-expected number of new jobs created in September, plus a higher-than expected retail sales number for September, has analysts further raising U.S. GDP growth estimates and making the Fed’s job of fighting inflation even harder.
At the same time, the U.S. Treasury is issuing an ever-expanding supply of new bonds causing some traditional Treasury buyers to step back, and the 10-year yield rose nearly a full percent higher than when I wrote the August 6th newsletter.
After the October 7th Hamas attack on Israel, the market is confronted with even further uncertainty and downside risk than it was already facing due to surging long-term yields. Crude has rallied to reflect a supply-interruption risk-premium, and there’s the risk that the conflict expands into a wider regional one. These are unpredictable risks, and the situation in the Middle East is likely to get worse before it gets better — and it will continue to weigh on sentiment. So, we have to take things day-by-day and week-by-week.
Don’t try to be a hero. Don’t fight a horrible tape.
Let’s look at the indexes. On Friday, the S&P 500 closed at the bottom of its day’s range, closed below price support at the early October closing low, and has fallen back below the 200 dma. Its MACD has triggered a new sell signal, as well.
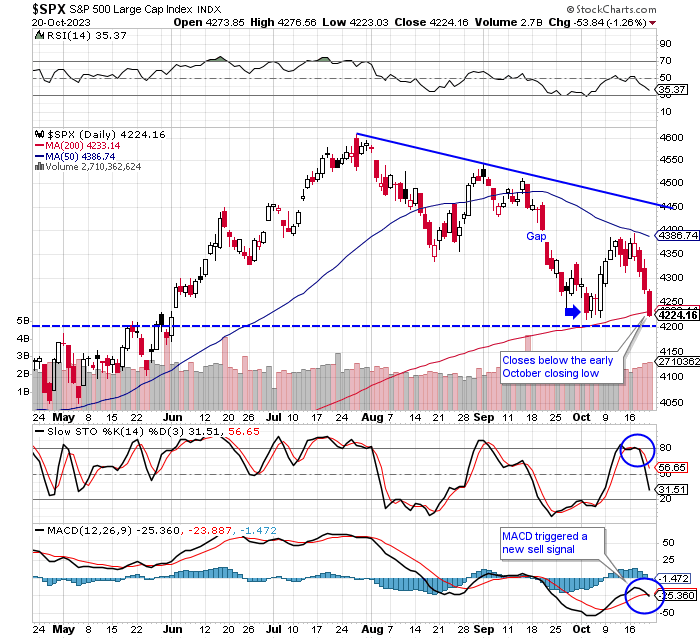
I had previously targeted a pullback to and test of the S&P 500 level (the dashed line on the chart), because 4200 has been a key support & resistance reflexivity level going back to early 2022. However, with the index falling hard into the 4200 area, and it having made a lower closing low of Friday, the 4200 level is unlikely to provide substantial support.
A 38.2% Fibonacci retracement of the market’s rally, from its October 2022 low to its late July high, is 4181 on the S&P 500. That’s not far from where we are now, and given the rally in long-term yields and the onset of the M.E. conflict, a pullback to the 50% Fibonacci retracement level at 4049 is a more pragmatic Fibonacci target for now.
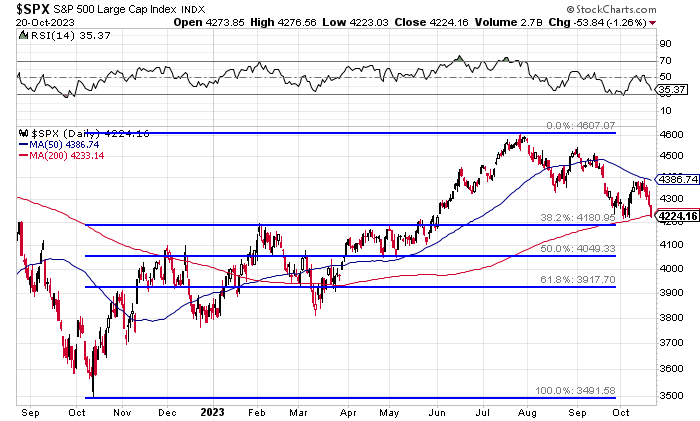
But given all of the uncertainty surrounding the Middle East conflict, its upward pressure on crude prices, and the big rally in long-term yields, I don’t want to set a hard price target for this pullback. I’ll follow the trend and the tape until they show substantive improvement, or we get a climactic looking sell-off “flush” followed by an upside reversal.
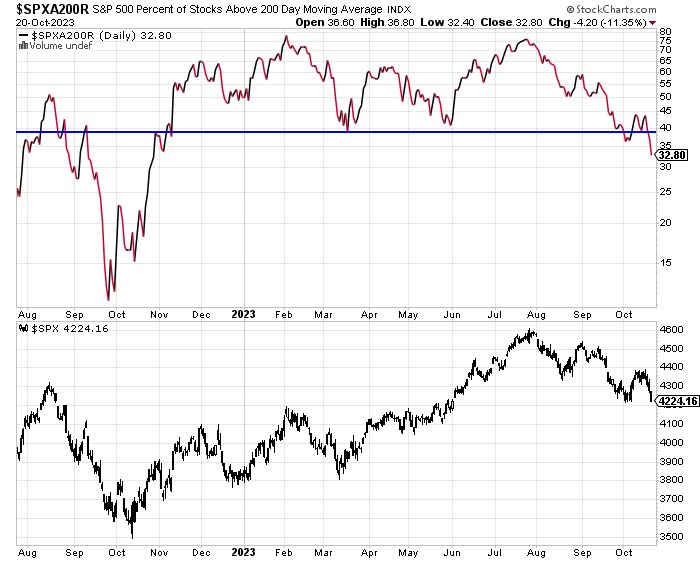
Under the surface, rising long-term yields have continued to hallow out market breadth. A sizeable market rally is highly unlikely without improving breadth, and improving breadth is unlikely without at least a pause and a pullback/consolidation in long-term yields. And of course, we have the uncertainty surrounding the Middle East conflict, as well.
There’s a variety of ways to measure market breadth, and none of them are looking good or are headed in the right direction. For example, the percentage of S&P 500 stocks trading below their 200 dma has fallen to a new low for the year.
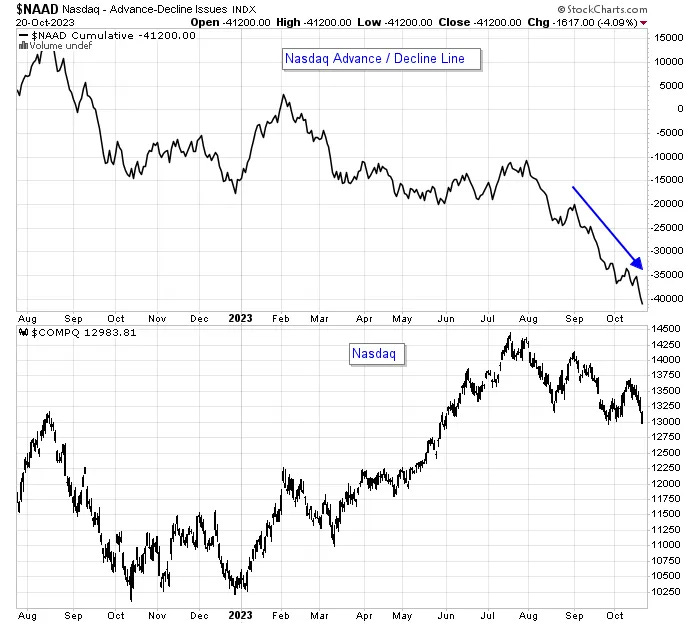
The Nasdaq has done the same, with the percentage of Nasdaq stocks below their 200 dma being even lower at 21%. And it’s the breadth on the Nasdaq that shows the real damage occurring beneath the surface of the major indexes. The ugly Nasdaq Advance/Decline line continues to get uglier, illustrating what the conditions are really like on the broader market when you look beyond and outside of the Magnificent 7 mega-cap tech stocks.
The bull’s best argument for a rally has been the seasonal rally we typically get from the middle of October through the end of the year. I’m not dogmatic about seasonality trends, which are simply averages, especially when they’re strongly opposed by the macro and fundamental backdrop, and a poor technical setup.
That’s why I’ve previously written that given the substantial technical deterioration we’ve seen in the broader market, and the big ramp in long-term yields, those expecting or hoping for a sizeable year-end rally are probably going to be disappointed at how muted it is, if in fact we get one. And that was before the October 7th onset of the Middle East conflict. Now, the uncertainty overhanging the market is even higher and the downside risks are greater.
We’re going into a big week of mega-cap tech earnings. Earnings season is the time when investors usually look past macroeconomic forces and focus on company-specific news moving stocks. But at this time, macro and geopolitical concerns are the dominant risk-determining narrative. Microsoft, Google, Meta and Amazon report 2nd quarter earnings this week. If they report good/strong results it may provide some footing for the market, or at least for their own stocks.
But the market is more than just the “Magnificent 7” mega-cap tech stocks which have been propping up the major indexes due to their sheer market-cap size. Meanwhile, the market of stocks around them has been floundering or worse. If those mega-cap tech companies in any way disappoint the market with their reports/guidance this week, things will probably get quite messy.
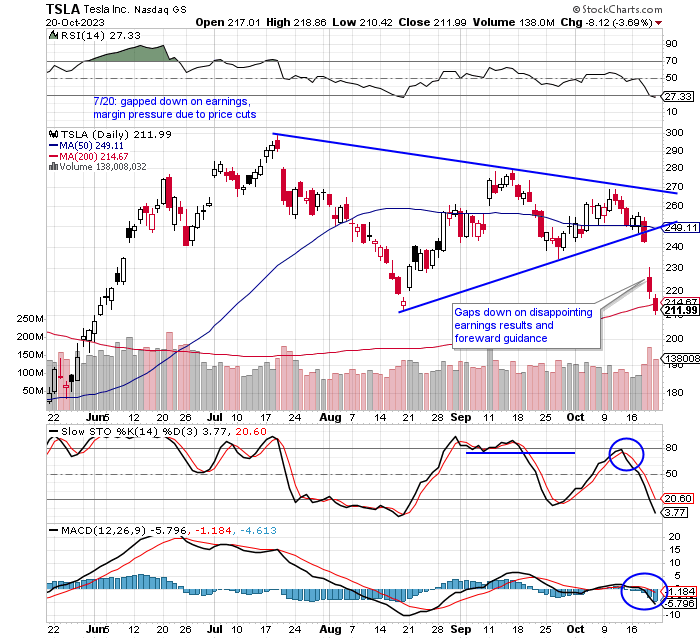
The fact that Tesla, last Wednesday, substantially disappointed the market with its 2nd earnings report and dour forward guidance certainly doesn’t help matters as Tesla is usually a good barometer of the market’s risk-on or risk-off appetite. Furthermore, Tesla is probably dead money for a good while as its valuation gets adjusted downward to reflect the company’s new realistic revenue and earnings prospects.
In short, market risks continue to remain very high and unless you’re an experienced short-seller it’s still best to remain defensive and wait for greener pastures.
On to a new/updated long & short focus watchlist.
Focus Watchlist
I try to recommend trades that are timely and that a breakout/breakdown is likely to occur soon. If I take a stock or ETF off the focus watchlist, it may be because the trade needs more time to ripen, it ran away from us, or I’m no longer considering it at all.
Keep reading with a 7-day free trial
Subscribe to Wade's Market Insights to keep reading this post and get 7 days of free access to the full post archives.