
Can Nvidia's GTC Conference Reignite the Semiconductor Sector and the Broader Market?
Can Nvidia's GTC Conference Reignite the Semiconductor Sector and the Broader Market?

Follow me @TheBon_Scott on Twitter, and please share this newsletter if you find my work valuable.
As we go into this week’s Fed meeting announcement on Wednesday, the first big potential market-moving event is Nvidia’s GTC conference, which begins on Monday. Nvidia (NVDA) is expected to provide more details on its next generation B100 Blackwell GPU. And it will likely make some additional product and partnership announcements, as well as lay out additional initiatives.
I am, however, skeptical that the conference is going to give Nvidia’s stock, the semiconductor sector, and the stock market the kind of sustainable seismic boost that bulls are hopeful for, for a number of reasons. As a reminder, I previously wrote that I think the Semiconductor ETF’s (SMH) intraday-bearish reversal on March 8th marked its medium-term term high.

The first reason I’m skeptical that Nvidia’s GTC conference can significantly reignite its stock, and the AI-fueled market rally, is that even after Nvidia’s pullback over the last 6 trading days — down 10% from its intraday high and off 5.2% on a closing basis — the stock remains very extended and there will likely be many holders looking to sell into rallies after the stock’s big March 8th bearish reversal.

Second, the semiconductor sector has a renewed headwind in the re-escalation of the U.S. - China AI semiconductor export restriction battle. I discussed this in my March 10th newsletter. Another shot was fired on March 14th when China urged the country’s EV auto manufacturers to sharply increase their semiconductor purchases from domestic auto chipmakers in its campaign to boost China’s domestic semiconductor industry, and reduce its reliance on Western imports.
Third, the recent rally in U.S. long-term Treasury yields is an intrinsic headwind against long-dated growth/tech stocks, dampening prospects for a resurgent tech rally until the market gets more friendly inflation data.
Keep a lookout for a Nvidia GTC conference spurred rally that gets heavily sold into. This would be a semi sector and broader market red flag.
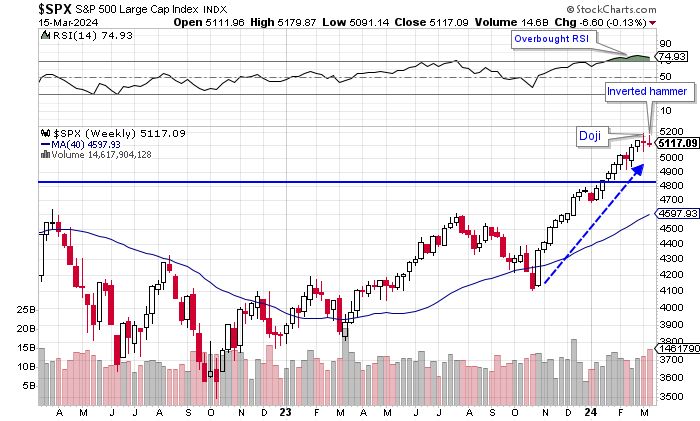
Moving to how the major market indexes are looking, in last weekend’s newsletter, I noted that the extended and overbought S&P 500 had printed a doji candlestick on its weekly chart, and that a pullback and consolidation period was most likely. This week, the S&P 500 printed an inverted hammer, which is a bearish candle as it typically indicates heavy selling into an attempted rally.
On its daily chart, the S&P 500 is testing the bottom-side of its uptrend channel as its momentum indicators are starting to turn down. This is occurring just before a Fed meeting announcement (on Wednesday) that I don’t think is going to provide any encouraging words for near-term market bulls. I’ll write more on that as we near the announcement.

The Equal-Weighted S&P 500, which gives us a better look at how the “average” stock in the market-cap weighted index is performing, has an ugly looking MACD. The nearly flat-lining MACD indicates poor momentum after the mid-February breakout, and it has just started triggering a new sell signal.

On to the tech-heavy Nasdaq 100, its chart is looking quite problematic. It has already started to break down below its uptrend channel, and its MACD has registered a decisive-looking sell signal. The Nasdaq 100 is likely facing a test of its 50 dma in the near future, and has a gap to fill at 17,482 — which is below its rising 50 dma.

Disclosure: Wade’s Market Insights (WMI) went leveraged short the Nasdaq 100 over March 7th and March 8th.
In conclusion, how Nvidia’s stock, and the broader tech space, react to Nvidia’s GTC conference is going to shed a lot of light on the potential seriousness of the market pullback that has begun.
Additionally, in determining the degree of whether the market might be entering a more substantive “risk-off” period, another thing to keep an eye on is the relative performance between the S&P 500 High Beta ETF and the S&P 500 Low Beta/Volatility ETF; it’s starting to slip. If we see a quick, sharp decline in this ratio it likely means that we're in for a more sizeable market decline. i.e. A decline below the Nasdaq 100’s and S&P 500’s dma-s, and possibly a decline to the S&P 500’s key support level at 4800.

That’s it for now. As always, I’ll be posting frequent market commentary on WMI’s private Twitter (X) page.
On separate note, I am pleased to announce that I will soon begin posting a new newsletter solely dedicated to short-sale ideas: Wade’s Short Sale Watchlist. I am very extensively experienced in short-selling. I will send out more information on this very unique newsletter, soon.
On to a new/updated long & short focus watchlist.
Focus Watchlist
I try to recommend trades that are timely and that a breakout/breakdown is likely to occur soon. If I take a stock or ETF off the focus watchlist, it may be because the trade needs more time to ripen, it ran away from us, or I’m no longer considering it at all.
Longs:
Keep reading with a 7-day free trial
Subscribe to Wade's Market Insights to keep reading this post and get 7 days of free access to the full post archives.